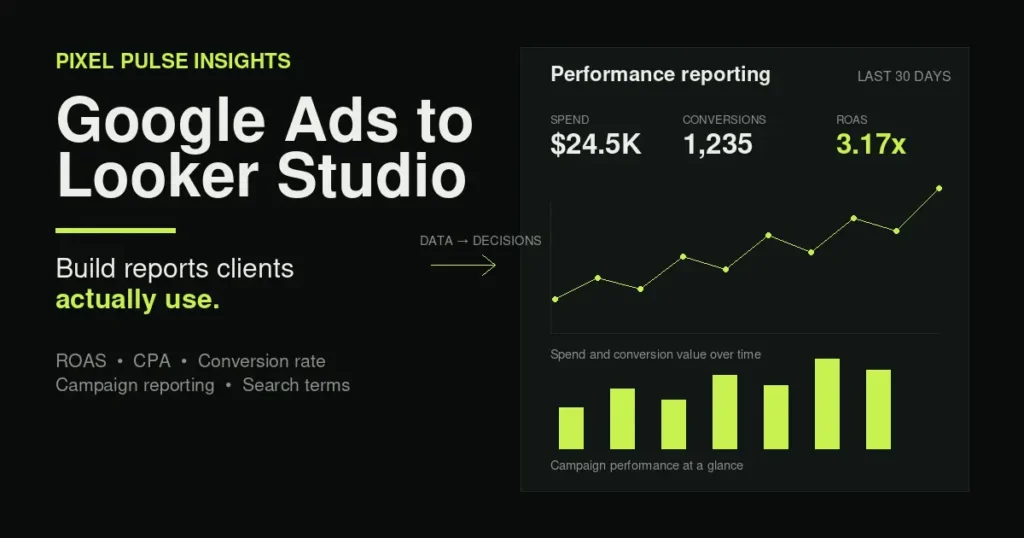
Connecting Google Ads to Looker Studio gives you a live, shareable reporting layer without forcing clients or stakeholders to work inside the Google Ads interface. The useful part is not the connection itself. It is choosing the right metrics, calculating them correctly, and arranging the report so someone can understand performance in a few seconds.
Quick answer: connect the Google Ads data source in Looker Studio, report on spend, conversions and conversion value, calculate ROAS and CPA from aggregated totals, then organize the dashboard around business outcomes rather than impressions and clicks.
What you will build
How to connect Google Ads to Looker Studio
In Looker Studio, create a report or data source and choose the Google Ads connector. Authorize the Google account that has access to the advertising account, then select the account you want to report on. Google documents Google Ads as one of the Google-built connectors available to Looker Studio.
- Open Looker Studio and create a new report or data source.
- Choose the Google Ads connector.
- Authorize the Google account that has access to the ad account.
- Select the individual Google Ads account you want to report on.
- Add the data source to the report and confirm the available dimensions and metrics.
If you manage multiple accounts through a manager account, decide whether you really want them combined. Separate client reports are usually easier to validate because account currency, conversion setup and reporting objectives can differ.
Official reference: Google Cloud: Connect to Google Ads in Looker Studio.
Which Google Ads metrics should a Looker Studio report include?
For most performance reports, start with a small set of fields that connect media spend to business outcomes:
Impressions and clicks are still useful diagnostic metrics, but they should not dominate a performance dashboard when the commercial questions are about acquisition volume, revenue, efficiency and return.
Conversions vs. All conversions
This distinction matters. Google Ads explains that the Conversions column is tied to the conversion actions included in your primary reporting and bidding setup, while All conversions can include additional actions and conversion sources. If your bidding logic is based on one definition and your dashboard reports another, performance can look better or simply different from what the campaigns are actually optimizing toward.
Official reference: Google Ads Help: About All conversions.
Conversion value must reflect the business value you intend to report
ROAS is only meaningful when the conversion value being passed into Google Ads represents the business value you intend to measure. Before building a dashboard, verify whether the account sends transaction revenue, lead values, static values, adjusted values, tax or shipping-inclusive values. Google notes that conversion values are used to measure and optimize the business impact of campaigns.
Official reference: Google Ads Help: About conversion values.
The three calculated fields that make the report useful
A client report becomes much more useful when it translates platform data into efficiency metrics. Create these calculated fields from aggregated totals.
ROAS
SUM(Conv. value) / SUM(Cost)Format the result consistently, for example as 3.42x. Google also describes conversion value divided by cost as a return-style efficiency metric.
Cost per acquisition (CPA)
SUM(Cost) / SUM(Conversions)Conversion rate
SUM(Conversions) / SUM(Clicks)Use aggregated totals for ratio metrics. Calculating a ratio row by row and then averaging those ratios can produce a misleading result when rows have different volumes.
A Looker Studio layout clients can understand quickly
A practical one-page dashboard can be organized into four reporting layers.
1. Outcome scorecards
Lead with spend, conversions, conversion value, ROAS and CPA. Enable previous-period comparison so each number has context.
2. Performance over time
Plot cost and conversion value by day. The purpose is to show whether the money going into the account is moving with the value coming out.
3. Campaign performance
Use campaign as the dimension, with cost, conversions, CPA and ROAS as the core metrics. Sorting by spend makes it easy to inspect the areas where performance has the largest financial impact.
4. Search terms
For Search campaigns, a search-term table gives stakeholders a direct view of what people typed before clicking. Pair search term with spend and conversions so irrelevant traffic and valuable queries are visible.
Common Google Ads to Looker Studio reporting mistakes
Reporting the wrong conversion column
If the account optimizes toward primary conversions but the report is built around All conversions, the dashboard can tell a different story from the bidding system. Define the reporting conversion set before choosing metrics.
Trusting conversion value without validating it
A perfectly designed dashboard cannot correct an incorrect revenue value. Test at least one conversion end to end and confirm the value that appears in Google Ads matches the intended business value.
Ignoring attribution timing
Recent dates can continue to change as conversions are attributed back to earlier ad interactions. Add a short reporting note so stakeholders understand why the last few days may not be final.
Assuming a stale dashboard means the Google Ads account is stale
Looker Studio data sources can use freshness settings and temporary cached results. Google Cloud documentation notes that data freshness controls how often a data source requests fresh data.
Official reference: Google Cloud: About Looker Studio data sources.
Building a beautiful dashboard on broken tracking
Before reporting, verify the measurement layer. Fire a test conversion, confirm it appears once, confirm the correct action is marked primary or secondary, and validate any value being passed. A dashboard can make bad data look authoritative, which is more dangerous than having no dashboard at all.
Recommended reporting checklist
Google Ads and Looker Studio FAQ
Is the Google Ads connector for Looker Studio free?
Google provides native connectors for products including Google Ads. Looker Studio itself has a no-cost version, although your broader Google or Looker setup may include paid products or services.
What is the best metric to put at the top of a Google Ads dashboard?
There is no single best metric for every business. For lead generation, conversions and CPA are usually central. For revenue-focused accounts, conversion value and ROAS are typically more useful. Spend should remain visible in either case.
Should I report Conversions or All conversions?
Use the conversion definition that matches the reporting objective. If you want the dashboard to reflect the actions the campaigns primarily optimize toward, start with Conversions. Use All conversions when you deliberately want a broader view that includes additional tracked actions.
Why does Google Ads data change after I send the report?
Conversion attribution and late-arriving data can update recent periods after the initial visit or click. For recurring reports, label recent data appropriately and avoid treating the newest dates as fully settled.
The reporting principle that matters most
The dashboard is not the measurement system. It is the presentation layer. If the tracking underneath is correct, Looker Studio can make Google Ads performance much easier to understand and share. If the tracking is wrong, the dashboard only makes the wrong answer easier to consume.
If you need help auditing Google Ads conversion tracking, GA4 measurement or building a performance dashboard, Pixel Pulse Media can help you turn the account data into reporting that is easier to act on.
Related services: Looker Studio reporting, GA4 and conversion tracking, and performance marketing audits.